Bull Trap Bull Run Stock Market Volatility Price Reverted Back — Stockfoto

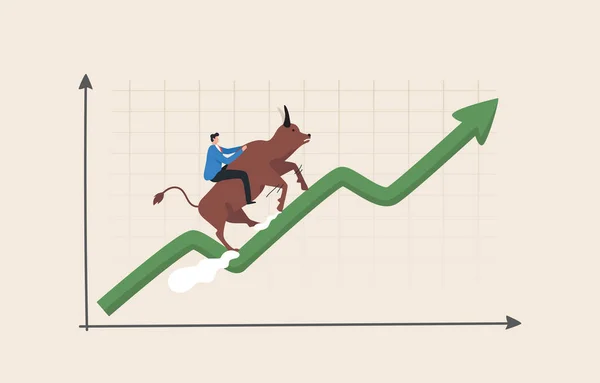
Bull Trap or Bull Run, stock market volatility. The price reverted back down quickly. Graph, Stock exchange, Financial, Bitcoin. The bull fell from the arrow chart. – illustration

Bull Trap or Bull Run, stock market volatility. The price reverted back down quickly. Graph, Stock exchange, Financial, Bitcoin. The bull fell from the arrow chart.

 — Illustration av yellow_man

Samma serie:

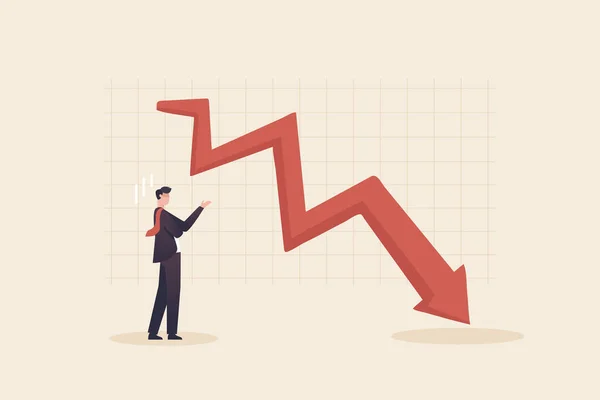
Arrow chart attacks a businessman or investor. Investment Risk, Stock market plunge, cryptocurrency or forex trading price decline, bear market concept.
Arrow Chart Attacks Businessman Investor Investment Risk Stock Market Plunge — Stockfoto
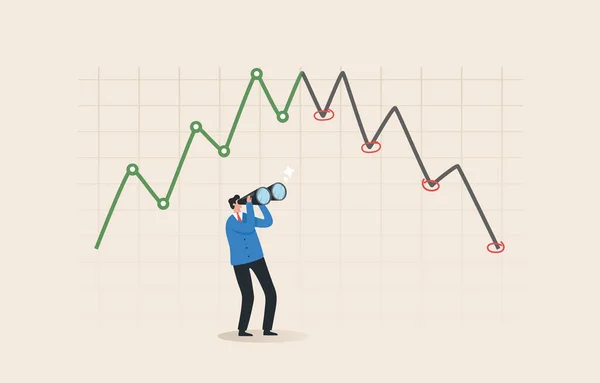
Stock market price prediction. Investment risk. Finding an entry point to buy or sell and make a profit. Investors use binoculars to view stock market prices.
Stock Market Price Prediction Investment Risk Finding Entry Point Buy — Stockfoto
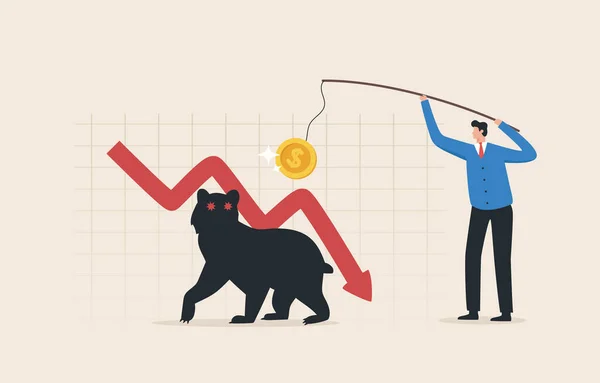
Bear Market, Investment strategy to get good returns in every crisis. Investors lure bears with capital injections.
Bear Market Investment Strategy Get Good Returns Every Crisis Investors — Stockfoto
Adjustments, Modifying investment portfolio from stock market crash,making bullish run concept.
Adjustments Modifying Investment Portfolio Stock Market Crash Making Bullish Run — Stockfoto
Bull market or Bull Run, Refers to the time when most investors buy. more demand than supply Market sentiment is high and prices go up. Bullish investors run on the upward arrow chart.
Bull Market Bull Run Refers Time Most Investors Buy More — Stockfoto
Financial Crisis , Stock Market Plunge. Businessman looks at the graph and is depressed.
Financial Crisis Stock Market Plunge Businessman Looks Graph Depressed — Stockfoto
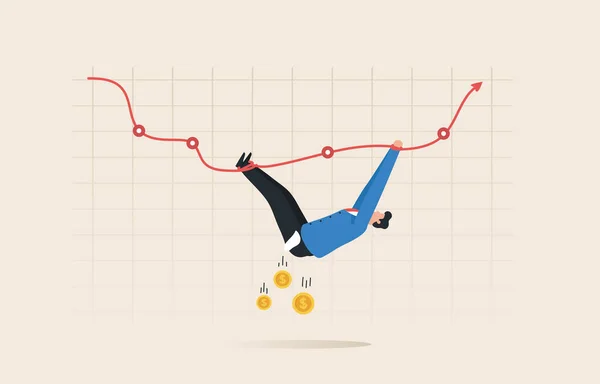
The stock market or crypto-currency is in decline. economic crisis or investment risk The concept of volatility. A businessman tries to climb the chart back to the top of the profit point.
Stock Market Crypto Currency Decline Economic Crisis Investment Risk Concept — Stockfoto
Inverted yield curve. Inflation, recession, government bond yields.
Inverted Yield Curve Inflation Recession Government Bond Yields — Stockfoto
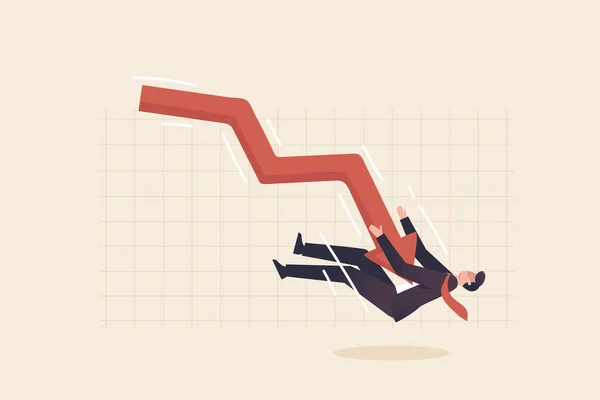
Financial Volatility, financial crisis, stock market. Falling Red Arrow Chart. The business man was wrapped his body tightly by the red arrow that fall down from the chart of stock market.
Financial Volatility Financial Crisis Stock Market Falling Red Arrow Chart — Stockfoto
Stock market price, rise enter the bull market. The business is growing positively. profitable business chart.
Stock Market Price Rise Enter Bull Market Business Growing Positively — Stockfoto
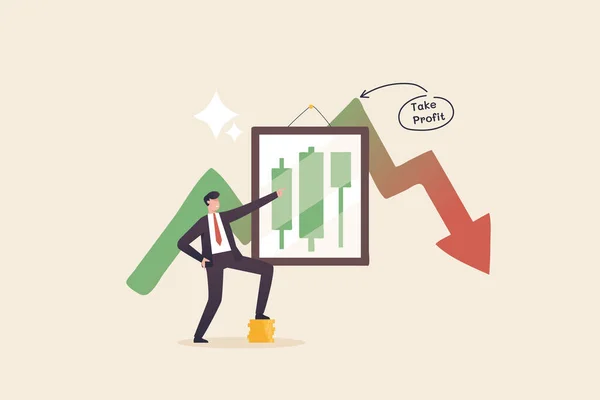
Profit point, Successful traders profit from investment trading. A young man or businessman stands to praise the success of making a profit.
Profit Point Successful Traders Profit Investment Trading Young Man Businessman — Stockfoto
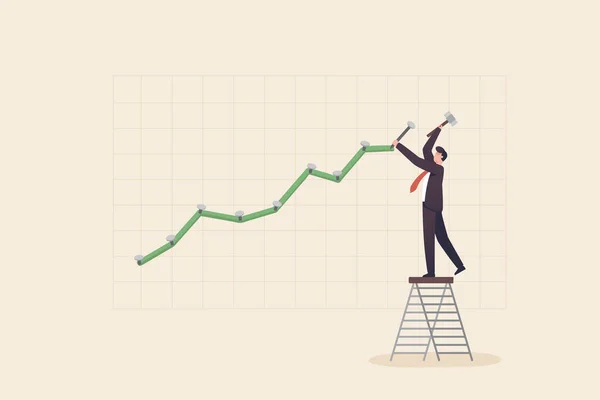
Businessman trying to repair the graph. stock market or crypto currency crash and going down, economic crisis or investing risk, volatility and fluctuation.
Businessman Trying Repair Graph Stock Market Crypto Currency Crash Going — Stockfoto
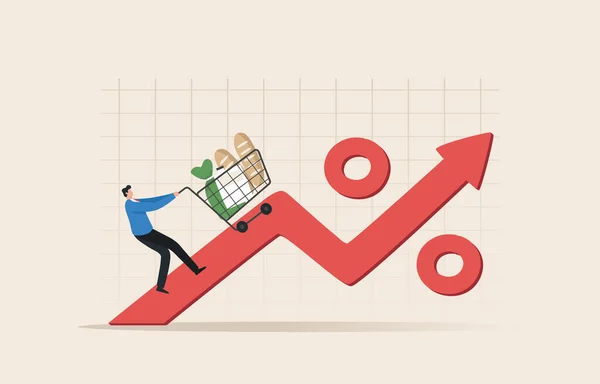
Food and Price Inflation Rises After Monetary Value Growth Ideas Financial problems and forecasting market crashes crisis risk. The young man pushed the shopping cart along the rising arrow chart.
Food Price Inflation Rises Monetary Value Growth Ideas Financial Problems — Stockfoto
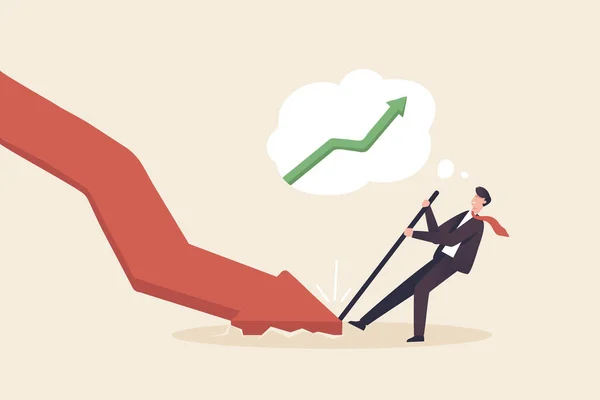
Broken arrow graph, Bankruptcy, economic crisis, loss of income. investment stabilization or the revival of the stock market. Businessman trying to push the arrow graph to point up from the stock market crisis.
Broken Arrow Graph Bankruptcy Economic Crisis Loss Income Investment Stabilization — Stockfoto
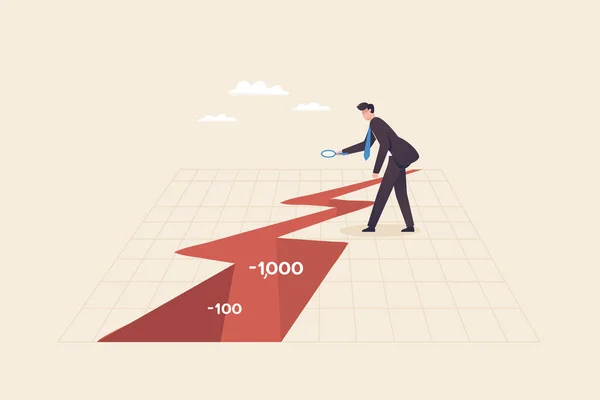
Financial volatility data analysis, financial crisis, money loss, risk assessment. Businessman holding a magnifying glass looks at a chart showing the volatile stock market.
Financial Volatility Data Analysis Financial Crisis Money Loss Risk Assessment — Stockfoto
Food inflation. The effect of the inflation rate on prices. Consumer price index or CPI. Prices of commodities and consumer goods rose due to rising inflation.
Food Inflation Effect Inflation Rate Prices Consumer Price Index Cpi — Stockfoto

Användningsinformation

Du kan använda denna royaltyfria illustration "Bull Trap or Bull Run, stock market volatility. The price reverted back down quickly. Graph, Stock exchange, Financial, Bitcoin. The bull fell from the arrow chart." för personliga och kommersiella ändamål enligt standardlicensen eller den utökade licensen. Standardlicensen omfattar de flesta användningsområden, inklusive reklam, design av användargränssnitt och produktförpackningar, och tillåter upp till 500 000 tryckta kopior. Den utökade licensen omfattar samtliga av standardlicensens användningsområden med obegränsade utskriftsrättigheter och låter dig använda de nedladdade illustrationerna för handelsvaror, återförsäljning av produkter eller gratis distribution.

Du kan köpa denna illustration och ladda ner den i hög upplösning upp till 6945x4445. Uppladdningsdatum: 6 sep. 2022